
Unclaimed brand
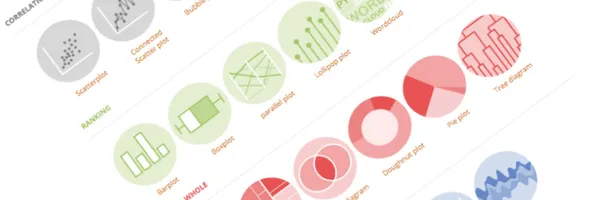
The D3 graph gallery displays hundreds of charts made with D3.js, always providing the reproducible code.
Liking this brand profile? Share this page

Hex Code
Color name
RGB
HSL
CMYK
#E0AC2B
Golden Grass
224, 172, 43
43, 74, 52
0, 23, 81, 12
#FFFFFF
White
255, 255, 255
0, 0, 100
0, 0, 0, 0
#000000
Black
0, 0, 0
0, 0, 0
0, 0, 0, 100
Yan Holtz is a brand that specializes in creating beautiful and interactive data visualizations using the D3. js library. With the D3 Graph Gallery, they provide a comprehensive collection of simple charts and graphs, each accompanied by reproducible code.
Whether you're interested in distribution, correlation, density, or ranking, Yan Holtz has you covered. Their extensive range of charts includes violin plots, boxplots, scatter plots, heatmap, word clouds, and much more. They even offer unique and visually stunning creations like circular barplots, treemaps, doughnut charts, and dendrograms.
Yan Holtz understands the importance of customization and interactivity in data visualization and provides tools and resources to make your charts truly unique. They also offer helpful shape helpers and address any potential caveats you may encounter. If you're looking to transform your data into captivating visualizations, Yan Holtz is your go-to brand.
Immerse yourself in the world of data art with Yan Holtz and explore the endless possibilities of D3. js
Brand industry
Computers Electronics and Technology
Company type
Suggest company type
Year founded
Suggest founded year
Company size
Suggest company size
The Yan Holtz name, logos and brand assets are trademarks of Yan Holtz and its affiliates. Brandfetch isn't affiliated with or endorsed by Yan Holtz. Their use is subject to Yan Holtz's brand guidelines.
