Yan Holtz
@r-graph-gallery.com
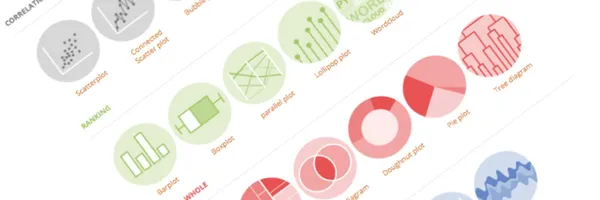
The R graph gallery displays hundreds of charts made with R, always providing the reproducible code.
Yan Holtz's Company Logos

Yan Holtz's Brand Colors
Hex Code
Color name
RGB
HSL
CMYK
#FD7E14
Ecstasy
253, 126, 20
27, 98, 54
0, 50, 92, 1
#FFFFFF
White
255, 255, 255
0, 0, 100
0, 0, 0, 0
#000000
Black
0, 0, 0
0, 0, 0
0, 0, 0, 100
About Yan Holtz
The R Graph Gallery is a valuable resource showcasing hundreds of R charts along with their reproducible code. R, a free software environment for statistical computing and graphics, is a widely used language in data science, alongside Python. It excels in data visualization, especially with tools like ggplot2.
The gallery's 400+ charts are organized by family and type, with a focus on code and explanations. Visitors, interested in R, data science, and data visualization, number around 800,000 per month. You can enhance your company's visibility by adding an image to every gallery page through sponsoring.
Monthly subscriptions are available, and feedback is appreciated. The gallery is a personal cheat-sheet, created to help others navigate R chart-building. Special thanks to sponsors, contributors, and friends who have supported this project.
Explore the R Graph Gallery for a wealth of data visualization insights and inspiration
Brand industry
Computers Electronics and Technology
Company type
Suggest company type
Year founded
Suggest founded year
Company size
Suggest company size