RGraph.net charts
@rgraph.net
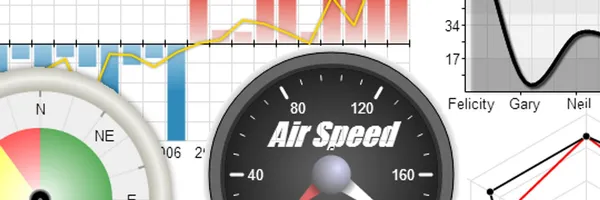
RGraph produces easy-to-use charts using JavaScript - over 60 different SVG and canvas types. Started in 2008, RGraph is Open Source.
RGraph.net charts's Company Logos

RGraph.net charts's Brand Colors
Hex Code
Color name
RGB
HSL
CMYK
#3EA6EB
Picton Blue
62, 166, 235
204, 81, 58
74, 29, 0, 8
#EFBA6B
Porsche
239, 186, 107
36, 80, 68
0, 22, 55, 6
#632400
Carnaby Tan
99, 36, 0
22, 100, 19
0, 64, 100, 61
About RGraph.net charts
RGraph is a leading provider of data visualization tools, offering a range of solutions designed to harness the power of HTML5 SVG and canvas technology. Stay up-to-date with the latest news, updates, and techniques for both RGraph and HTML5 SVG and canvas tags by reading the RGraph blog for the year 2023. Our blog features a wealth of helpful resources, including video transcripts, new demos, and examples of cutting-edge techniques.
RGraph's products and services include version updates, new example charts, and helpful tutorials for utilizing features like notification messages and parallax scrolling. Our website also offers demos, documentation, and a support forum to assist users in maximizing the potential of our visualization tools. Whether you're a seasoned professional or new to data visualization, RGraph's comprehensive range of offerings and support resources make it easy to create stunning and impactful visual representations of your data.
Brand industry
Computers Electronics and Technology
Company type
Suggest company type
Year founded
Suggest founded year
Company size
Suggest company size